


SAP Performance Tuning
SAP Performance Tuning is the major activity in the SAP as a BASIS admin, because systematic, proactive performance optimization increases the benefits of your R/3 system and reduces the cost of ownership. The consequences of poor performance tuning may be additional work, production delays, and financial loss. In this post we will describe as how to identify and solve the performance problems in SAP system.
Guidelines for SAP Performance Tuning
Analyze carefully: Before you change anything, analyze your system carefully. Determine the areas of your R/3 system in which performance problems occur. Changes should be performed only in these areas. Keep a record of your analysis data and main thing is that change as little as possible but as much as necessary.
-------------------------------------------------------------------------------------------------------------------------
Before you going ahead with performance tuning first you need to understand how the communication is happening during running the system between three layers, the diagram is simple flow chart is simple to describe this scenario.

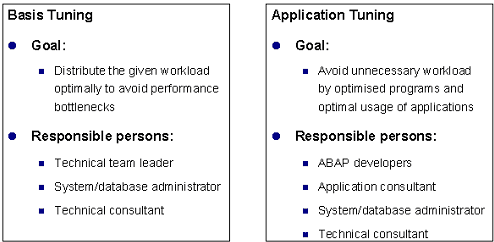
Tuning Categories
Performance Tuning we can categorize into t types.
1) Technical tuning
2) Application tuning.
Technical tuning:
- Configuring all the components of the R/3 system, so that load placed on the system by users can be optimally processed and does not cause performance bottlenecks.
- The components for technical tuning are the operating system, the database, the R/3 work processes, R/3 buffers memory management and the net work.
- Technical tuning is necessary for every R/3 system. In the technical tuning generally we can check the parameters of work processes, memory allocation, logon groups configuration and load distribution.
Application Tuning:
- Which deals with the programs of R/3 application modules. The main focus is on verifying the necessity and efficiency of processes in applications and minimizing the use of resources such as main memory, CPU, network transfers, and hard disk access.
- Application tuning typically results in more effective use of R/3 transactions or improved performance of customer developed ABAP programs.
- Application tuning is necessary for every R/3 system. In application tuning, the amount of work required increases, with the size of the installation, as reflected in the data volume, the number of users, and the number of customer developed programs and customer modifications to standard SAP objects.
Verifying Tuning Results:
executing the action list, you should reanalyze the R/3 system to verify the success or failure of performance optimization. If desired improvements are not achieved or only partially achieved, another optimization cycle is required. After large scale performance tuning, new problems sometimes occur, so that also need to be solved.
Performance monitor for R/3 applications:


Basis tuning tasks:
1) Optimize System Parameters
- R3 parameters (for example: Memory Management)
- Database parameters (for example: Database buffer sizes)
- Operating system and network parameters

2) Optimize Database Disk layout through I/O balancing
3) Optimization of Workload distribution
- Number of work processes, Background scheduling, log-on groups
4) Verify hardware sizing by detecting hardware bottlenecks
Traces with ST01:

a) In ST01 we can do traces with Analysis
Memory Tuning in ST02:

The buffer tune summary transaction displays the R/3 buffer performance statistics. It is used to tune buffer parameters of R/3 and, to a lesser degree, the R/3 database and operating system.
The buffer is important because significant buffer swapping reduces performance. Look under Swaps for red entries. Regularly check these entries to establish trends and get a feel of the buffer behavior.
In the Command field, enter transaction ST02 and choose Enter (or choose Tools Administration, then Monitor > Performance, and then Setup/Buffers > Buffers).
Based on the buffer hit ratio and swaps In the St02 you can get the relevant data as which parameters needs to be checked for further analysis and performance tuning.
The two important things to review:
Hit Ratio: for which the target value is 95 percent and higher. Soon after starting the system, this value is typically low, because certain buffers are empty. The hit ratio will increase as the system is used and the buffers are loaded. It usually takes a day to load the buffers that are normally used.
Swaps: for which the target value is less than 1,000. Swaps occur when the necessary data is not in the buffer. The system has to retrieve the data from the database. The swap value is reset to zero (0) when the system is restarted.
Buffer swaps may be due to
- Buffer too small, out of space,
- Out of buffer directory entries
- Fragmentation in buffer, particularly the program buffer
- If program buffer exceeds 10,000, it should be investigated
- Generic table buffer
- Sometimes very large buffered objects should be un buffered (over 2MB)
Work load analysis with ST03:

2) Statistics should be checked, and trends should be recorded to get a “feel” for the system’s behavior and performance. Understanding the system when it is running well will help determine what changes need to be made when it is not.
3) Check Response times
4) Choose Detailed analysis menu from toolbar.
5) Choose One recent period from Performance history, Global.
6) We can choose a time period for comparison: Today, Previous days, This week, Previous weeks, This month, Previous months.
7) Choose Dialog at the bottom of the screen
8) Choose Transaction profile from the toolbar
9) Main menu dialog step average time should be very short, If it is not, this could indicate a dialog instance bottleneck
Key dialog response times should be less than 1-2 seconds per step.
Key dialog transaction step time components:
- Wait time should be very short
- DB time should be much less than CPU time.
- Compare the servers
- Choose Detailed analysis menu from toolbar
- Choose Compare all servers from Performance history, Global.
- This indicates average performance across all instances
- If there is a performance problem specific to an instance, Avg wait time and CPU time will be the best indicators.

Database Performance Analysis:

Oracle data buffer checks:
- Check If there are more than a few million reads, the buffer quality should be > 98%
- < 98% could indicate buffer too small or expensive SQL statements.
- Buffer waits should be < 5% of reads 5% could indicate I/O bottleneck.

Oracle call statistics checks
- Reads per user call should be < 40
- 40 could indicate expensive SQL.
- User calls / recursive calls should be>5
- < 5 could indicate that the Shared Pool may be too small.
Oracle call statistics checks
- Reads per user call should be < 40
- 40 could indicate expensive SQL.
- User calls / recursive calls should be > 5
- < 5 could indicate that the Shared Pool may be too small.
Oracle shared Pool statistics checks
- DD cache quality should be > 90%
- < 90% could indicate that the Shared Pool is too small
- SQL Area get ratio, pin ratio should be > 90%
- < 90% could indicate that the Shared Pool is too small
Check the Performance in ST05:

Check database SQLLook for statements with
- More than 1,000-10,000 buffer gets / record (most optimization potential)
- Buffer gets / total reads since start in more than 5% of the total
- More than a few executions
- Larger fraction of reads from disk than other statements
- Double click on line to get more information
- Once displayed, the “Explain” option can be selected for further analysis
Expensive SQL statement Means
- From user point of view: Lengthy response time of transaction using the statement
- From the system point of view: Many data blocks are scanned to find the selected records
Consequences of Expensive SQL statement
- Database is busy reading with many data blocks
- High CPU load on Database Server
- Work process is block by report & wait time for other processes
- Many blocks are displaced from Database buffer
- Cache hit rate for other SQL statement suffers
- Expensive SQL statement reduces the performance of the entire R3 System.
Detecting Expensive SQL statements:
- What to detect: Reports or transactions where database request time is a large fraction of response time
- SQL statement with a high number of buffer gets
For each Expensive SQL Statement find out:
- Table Name
- Where Clause
- Indexes used
- Name of the report or transaction containing the statement
Operating System Monitor in ST06:


- CPU utilization and system load
- Check idle %
- Check load average
- Load average should be > 1.5
- Physical and virtual memory
- Swap statistics
- Slowest disk
- LAN statistics
Analyzing the hardware bottle neck:
From a user point of view:
- Lengthy response time for transactions
From the system point of view
- CPU Utilization is 100 %
- High average number of work process are waiting for CPU resources
- High paging rates
- Lengthy disk response times
- Lengthy network response times
Reasons
- Incorrect sizing of physical main memory, CPU, etc…
- Incorrect workload distribution
- Expensive Programs (SQL Programs, External Programs)
- Incorrect disk layout or slow disks
- Incorrect network topology
We can also check the ST07 to monitor user distribution based on the application components.


